Moisture
Wood movement in numbers: how much a slab shrinks and swells
Movement coefficients, worked slab examples and European equilibrium moisture tables explain how humidity changes wood dimensions.
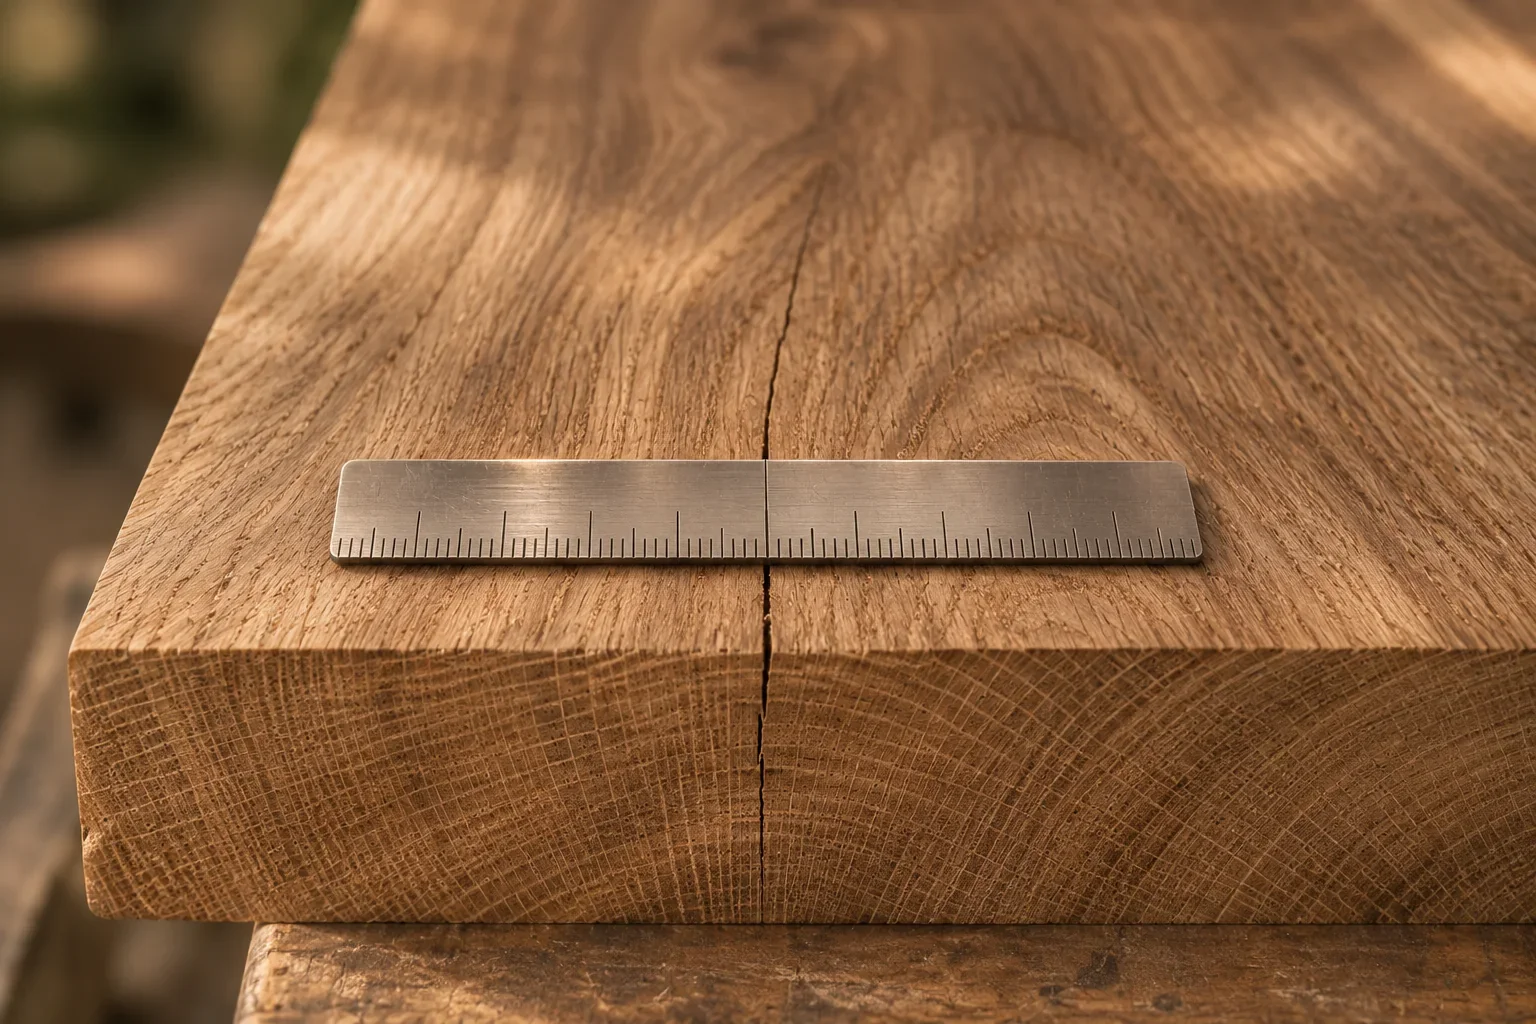
A 900 mm wide flat-sawn European oak top changes width by about 13 mm when its moisture content changes by 4 percentage points. A quarter-sawn top of the same width changes by about 5.8 mm. Wood moves because its moisture content follows the humidity of the air around it.
Key facts#
- Wood shrinks and swells with moisture only below the fibre saturation point, which averages about 30 percent moisture content according to the Wood Handbook.
- Movement along the growth rings, called tangential movement, is about twice movement across them, called radial movement, while total shrinkage along the length is 0.1 to 0.2 percent from green to oven-dry for most species according to the Wood Handbook.
- European oak has movement coefficients of 0.36 percent tangential and 0.16 percent radial per percentage point of moisture change in LWF Wissen 75.
- Our oak calculation using LWF coefficients gives 13.0 mm of flat-sawn movement and 5.8 mm of quarter-sawn movement across a 900 mm top for a moisture change of 4 percentage points.
- European beech has the highest tangential coefficient in our table, 0.41 percent per percentage point of moisture change, giving 14.8 mm of movement across 900 mm for a moisture change of 4 percentage points.
- At 20 °C, our calculation with the Wood Handbook equation gives about 6.2 percent wood moisture content at 30 percent relative humidity and about 16.0 percent at 80 percent relative humidity.
- Our outdoor table for 1991 to 2020 gives Barcelona the smallest yearly swing, 1.8 percentage points, and Madrid the largest, 8.8 percentage points.
- Our lower-bound winter heating calculation gives 3.8 percent EMC for Helsinki and 8.4 percent for Lisbon when January air is heated to 21 °C without added moisture.
Source: USDA Forest Products Laboratory, Wood Handbook; Bavarian State Institute of Forestry, LWF Wissen 75, Tabelle 3; our calculations using these references and Open-Meteo ERA5 climate inputs.
Last updated: 20 November 2026.
Why wood changes size#
The USDA Forest Products Laboratory explains that below fibre saturation, changes in bound water change the dimensions of the cell walls. Its Wood Handbook distinguishes tangential movement along the growth rings from radial movement across them. Movement along the grain is much smaller.
A thick slab can have a dry surface and a wetter centre. The handbook explains that its surface can begin shrinking while the average moisture content remains above fibre saturation. The rule applies to the wood locally, rather than to an average reading for the whole piece.
Source: USDA Forest Products Laboratory, Wood Handbook, moisture relations and dimensional stability.
The wood movement calculator formula#
We calculate movement from the published species coefficients:
Change in width = width × coefficient ÷ 100 × change in moisture content, in percentage points.
Use the same length unit for the starting width and the result. The coefficient expresses the percentage change in dimension per percentage point of wood moisture change. Air relative humidity and wood moisture content are different quantities.
For width calculations, flat-sawn means mostly tangential movement; quarter-sawn means mostly radial movement. The USDA Forest Products Laboratory uses these directional choices when estimating width shrinkage. Ring angles can change across a natural slab, so the result remains an estimate for the individual piece.
Source: USDA Forest Products Laboratory, Wood Handbook, shrinkage calculations, and Bavarian State Institute of Forestry, LWF Wissen 75, Tabelle 3.
Movement coefficients by species#
LWF gives European beech the highest tangential coefficient in our table, 0.41 percent, while sweet chestnut has the lowest tangential range endpoint, 0.21 percent. Sycamore maple has the lowest radial endpoint, 0.10 percent, in LWF; the highest radial endpoint is 0.24 percent, reported for robinia in the Handwerk und Technik workbook and birch in GD Holz. These coefficients describe dimensional change per percentage point of wood moisture change.
| Species | Tangential (% per 1% moisture change) | Radial (% per 1% moisture change) | Source |
|---|---|---|---|
| European oak | 0.36 | 0.16 | LWF Wissen 75, Table 3 |
| European beech | 0.41 | 0.20 | LWF Wissen 75, Table 3 |
| European ash | 0.38 | 0.21 | LWF Wissen 75, Table 3 |
| European walnut | 0.25 to 0.30 | 0.18 to 0.23 | GD Holz, Holzarten-ABC |
| Black walnut | 0.27 | 0.19 | GD Holz, Holzarten-ABC |
| Sycamore maple | 0.22 to 0.30 | 0.10 to 0.20 | LWF Wissen 75, Table 3 |
| Sweet chestnut | 0.21 to 0.26 | 0.14 | LWF Wissen 75, Table 3 |
| Hornbeam | 0.35 to 0.39 | 0.23 | GD Holz, Holzarten-ABC |
| Robinia | 0.38 | 0.24 | Handwerk und Technik workbook |
| European cherry | 0.26 to 0.33 | 0.16 to 0.18 | GD Holz, Holzarten-ABC |
| European elm | 0.23 | 0.20 | Frey-Amon timber reference |
| European lime | 0.24 to 0.32 | 0.15 to 0.23 | GD Holz, Holzarten-ABC |
| Silver birch | 0.26 to 0.31 | 0.18 to 0.24 | GD Holz, Holzarten-ABC |
| European larch | 0.30 | 0.14 | Handwerk und Technik workbook |
| Norway spruce | 0.39 | 0.19 | LWF Wissen 75, Table 3 |
| Scots pine | 0.36 | 0.19 | LWF Wissen 75, Table 3 |
Where a source gives a range, our table preserves that range. The German references call this value “differentielles Schwindmaß”, sometimes paired with “Quellmaß” for swelling. LWF specifies a working moisture range of 5 to 20 percent for its coefficients; these are working-range estimates rather than a rule to extend through green wood.
Source: LWF Wissen 75, Tabelle 3 and the species references identified in the table and Sources section.
Worked movement examples in millimetres#
Our calculation gives European beech the largest flat-sawn result, 14.8 mm, compared with sweet chestnut's 7.6 to 9.4 mm. For quarter-sawn material, sycamore maple reaches the lowest endpoint, 3.6 mm, while robinia reaches 8.6 mm. The comparisons use the same width and moisture change throughout.
| Species | Flat-sawn board: change across 900 mm (mm) | Quarter-sawn board: change across 900 mm (mm) |
|---|---|---|
| European oak | 13.0 | 5.8 |
| European beech | 14.8 | 7.2 |
| European ash | 13.7 | 7.6 |
| European walnut | 9.0 to 10.8 | 6.5 to 8.3 |
| Black walnut | 9.7 | 6.8 |
| Sycamore maple | 7.9 to 10.8 | 3.6 to 7.2 |
| Sweet chestnut | 7.6 to 9.4 | 5.0 |
| Hornbeam | 12.6 to 14.0 | 8.3 |
| Robinia | 13.7 | 8.6 |
| European cherry | 9.4 to 11.9 | 5.8 to 6.5 |
| European elm | 8.3 | 7.2 |
| European lime | 8.6 to 11.5 | 5.4 to 8.3 |
| Silver birch | 9.4 to 11.2 | 6.5 to 8.6 |
| European larch | 10.8 | 5.0 |
| Norway spruce | 14.0 | 6.8 |
| Scots pine | 13.0 | 6.8 |
Our millimetre table assumes a 900 mm wide board and a moisture change of 4 percentage points, for example from 8 to 12 percent. Formula: width × coefficient ÷ 100 × moisture change. Using LWF's European oak coefficients, our worked examples are 900 × 0.36 ÷ 100 × 4 = 13.0 mm for flat-sawn material and 900 × 0.16 ÷ 100 × 4 = 5.8 mm for quarter-sawn material.
Drying produces shrinkage; moisture gain produces swelling. These figures describe the estimated change across the board's width, rather than a complete fixing or joint specification.
Source: Our calculations using the coefficient table; oak coefficients from LWF Wissen 75, Tabelle 3.
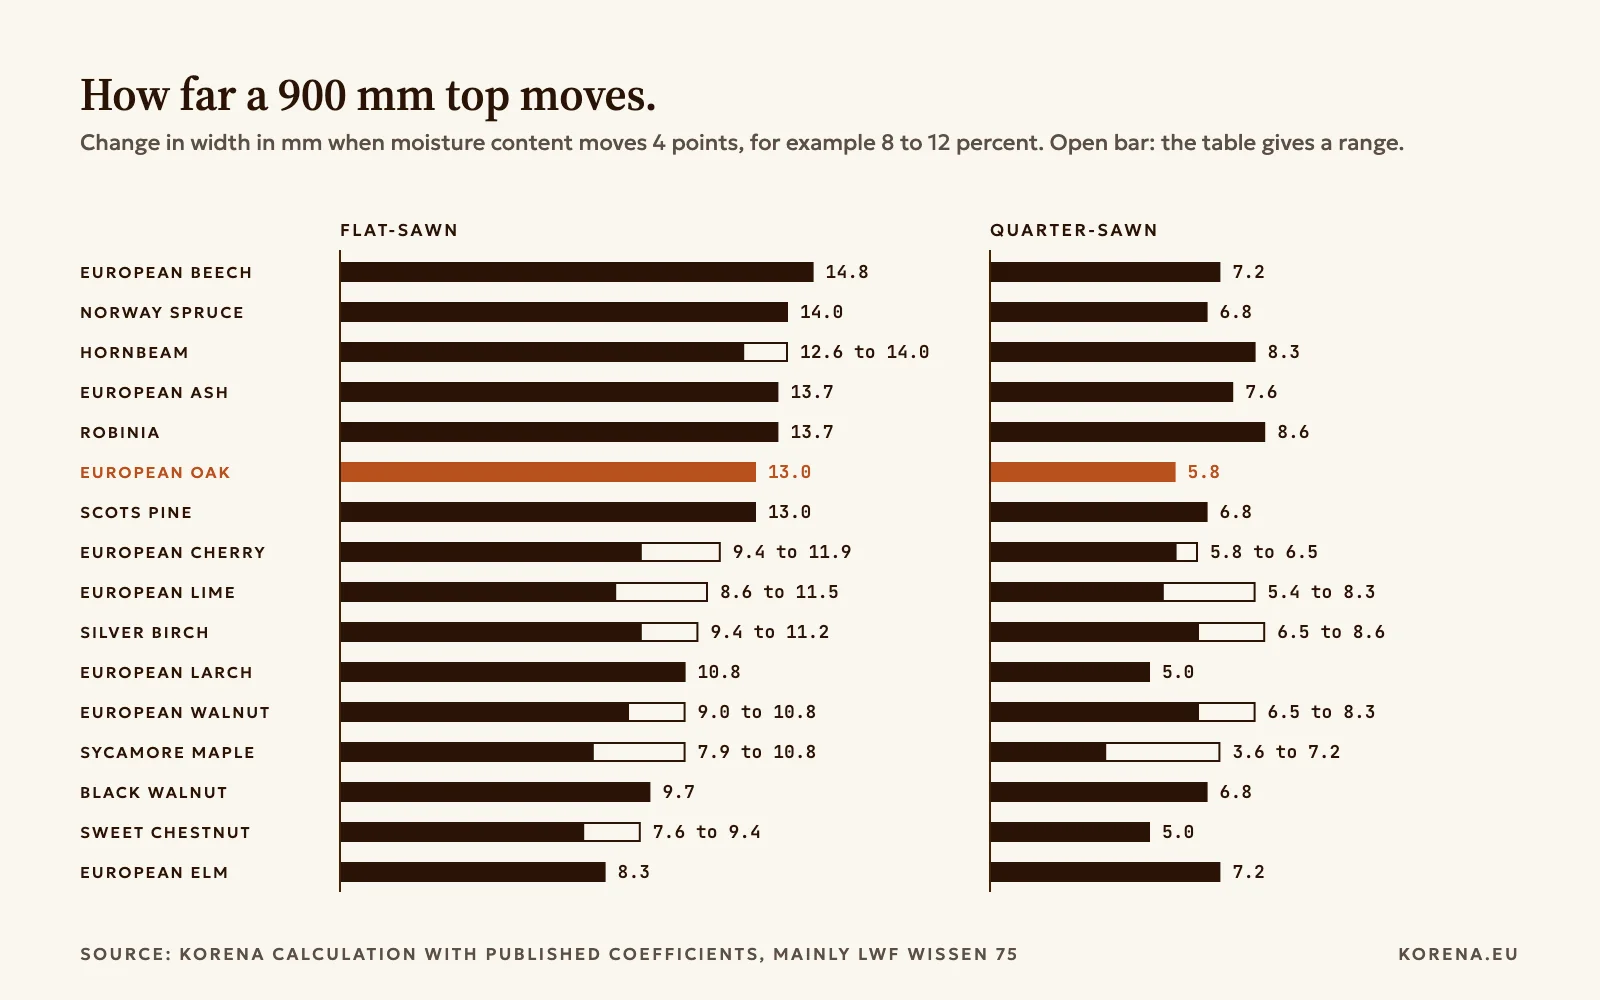 View full size
Total shrinkage is a different measurement#
CIRAD reports total tangential shrinkage of 11.6 percent for European beech, compared with 6.9 percent for sweet chestnut and robinia. Its European oak sheet gives 9.7 percent tangential shrinkage, 4.5 percent radial shrinkage and a fibre saturation point of 31 percent. Our table keeps each figure attached to its named reference.
| Species | Total tangential shrinkage (%) | Total radial shrinkage (%) | Tangential ÷ radial | Fibre saturation point (%) | Source |
|---|---|---|---|---|---|
| European oak | 9.7 | 4.5 | 2.2 | 31 | CIRAD Tropix 7 species sheet |
| European beech | 11.6 | 5.7 | 2.0 | 32 | CIRAD Tropix 7 species sheet |
| European ash | 9.6 | 5.7 | 1.7 | 32 | CIRAD Tropix 7 species sheet |
| European walnut | 7.5 | 5.5 | 1.4 | not stated | CIRAD Tropix 7 species sheet |
| Black walnut | 7.8 | 5.5 | 1.4 | not stated | USDA FPL Wood Handbook, Table 4-3 |
| Sycamore maple | 7.8 | 4.5 | 1.7 | not stated | CIRAD Tropix 7 species sheet |
| Sweet chestnut | 6.9 | 4.2 | 1.6 | 30 | CIRAD Tropix 7 species sheet |
| Hornbeam | 11.5 | 5.2 to 6.8 | not computed | 32 to 35 | Molnár and Bariska (2002), as reproduced in Pozsgayné Fodor (2023) |
| Robinia | 6.9 | 4.4 | 1.6 | 30 | CIRAD Tropix 7 species sheet |
| European cherry | 8.4 | 5.1 | 1.6 | 25 | CIRAD Tropix 7 species sheet |
| European elm | 8.3 | 4.6 | 1.8 | not stated | Frey-Amon timber reference (Ulmus spp.) |
| European lime | 8.5 | 5.5 | 1.5 | not stated | W.A.V.E. species catalogue (2025) |
| Silver birch | 7.8 | 5.3 | 1.5 | not stated | Silva Fennica Monographs 1 (2000) |
| European larch | 8.2 | 4.2 | 2.0 | 26 | CIRAD Tropix 6 sheet |
| Norway spruce | 8.2 | 3.9 | 2.1 | 33 | CIRAD Tropix 7 species sheet |
| Scots pine | 8.3 | 5.2 | 1.6 | 30 | CIRAD Tropix 7 species sheet |
Total shrinkage covers the whole drying path from green wood to oven-dry wood. The USDA Forest Products Laboratory expresses it relative to the green dimension. A movement coefficient instead describes dimensional change per percentage point of moisture change within a working range.
A total shrinkage percentage is therefore not a seasonal movement percentage. The fibre saturation column also preserves gaps in the references: “not stated” means the cited source does not provide that value for our table.
Source: CIRAD Tropix species sheets and the other references named in the table; definitions from the USDA Forest Products Laboratory Wood Handbook.
What moisture content the air gives wood#
Equilibrium moisture content, or EMC, is the moisture content at which wood is neither gaining nor losing moisture. The USDA Forest Products Laboratory relates it to air temperature and relative humidity.
Our grid, calculated with the handbook equation, gives 6.2 percent EMC at 20 °C and 30 percent relative humidity, compared with 16.0 percent EMC at the same temperature and 80 percent relative humidity. At 50 percent relative humidity, the temperature comparison runs from 9.5 percent EMC at 0 °C to 9.0 percent at 30 °C. Across these conditions, humidity matters far more than temperature.
| Relative humidity | 0 °C | 10 °C | 20 °C | 30 °C |
|---|---|---|---|---|
| 20% | 4.6% | 4.6% | 4.5% | 4.3% |
| 30% | 6.3% | 6.3% | 6.2% | 6.0% |
| 40% | 7.9% | 7.9% | 7.7% | 7.5% |
| 50% | 9.5% | 9.5% | 9.3% | 9.0% |
| 60% | 11.3% | 11.2% | 11.0% | 10.6% |
| 65% | 12.4% | 12.3% | 12.0% | 11.6% |
| 70% | 13.5% | 13.4% | 13.1% | 12.7% |
| 80% | 16.5% | 16.4% | 16.0% | 15.5% |
| 90% | 21.0% | 20.9% | 20.5% | 20.0% |
We use Equation (4-5) in the USDA Forest Products Laboratory's Wood Handbook. Our check reproduces its published values at 21.1 °C: 6.2, 9.2, 12.0 and 16.0 percent EMC at relative humidities of 30, 50, 65 and 80 percent, respectively.
These values describe equilibrium conditions. They do not give a drying time or establish the current moisture content of a slab. The handbook also cautions that actual EMC varies between specimens and with moisture history.
Source: USDA Forest Products Laboratory, Wood Handbook, Equation (4-5) and Table 4-2.
Outdoor equilibrium moisture across Europe#
Our table covers 25 European cities using climate means for 1991 to 2020. Barcelona has the smallest yearly swing, 1.8 percentage points, and Madrid the largest, 8.8 percentage points. Our lowest monthly value is Madrid in July at 7.0 percent EMC; the highest is Helsinki in November and December at 21.0 percent EMC.
Monthly, lowest and highest values are wood moisture content in percent. Yearly swing is expressed in percentage points and equals the difference between the displayed highest and lowest values.
| City | Jan | Feb | Mar | Apr | May | Jun | Jul | Aug | Sep | Oct | Nov | Dec | Lowest | Highest | Yearly swing |
|---|---|---|---|---|---|---|---|---|---|---|---|---|---|---|---|
| Lisbon, Portugal | 16.4 | 15.7 | 15.1 | 15.0 | 14.7 | 14.4 | 14.4 | 14.3 | 14.8 | 15.8 | 16.2 | 16.7 | 14.3 (Aug) | 16.7 (Dec) | 2.4 |
| Madrid, Spain | 15.5 | 13.3 | 11.6 | 11.0 | 10.1 | 8.3 | 7.0 | 7.3 | 9.1 | 12.1 | 14.6 | 15.8 | 7.0 (Jul) | 15.8 (Dec) | 8.8 |
| Barcelona, Spain | 15.8 | 15.3 | 15.3 | 15.4 | 15.4 | 14.8 | 14.5 | 14.8 | 15.3 | 16.3 | 15.9 | 16.0 | 14.5 (Jul) | 16.3 (Oct) | 1.8 |
| Paris, France | 19.6 | 17.7 | 15.4 | 14.0 | 14.2 | 13.8 | 13.0 | 13.2 | 14.9 | 17.6 | 19.9 | 20.3 | 13.0 (Jul) | 20.3 (Dec) | 7.3 |
| London, United Kingdom | 19.1 | 17.8 | 16.2 | 15.0 | 14.6 | 14.5 | 14.4 | 14.9 | 16.1 | 17.8 | 19.5 | 19.7 | 14.4 (Jul) | 19.7 (Dec) | 5.3 |
| Dublin, Ireland | 19.0 | 18.3 | 17.3 | 16.6 | 16.3 | 16.3 | 16.7 | 17.1 | 17.8 | 18.4 | 19.3 | 19.4 | 16.3 (May) | 19.4 (Dec) | 3.1 |
| Brussels, Belgium | 19.2 | 17.8 | 15.8 | 14.2 | 14.3 | 14.5 | 14.4 | 14.8 | 16.2 | 17.8 | 19.8 | 20.1 | 14.2 (Apr) | 20.1 (Dec) | 5.9 |
| Amsterdam, Netherlands | 19.6 | 18.4 | 16.7 | 15.0 | 14.7 | 15.2 | 15.4 | 16.0 | 17.5 | 18.7 | 20.2 | 20.3 | 14.7 (May) | 20.3 (Dec) | 5.6 |
| Berlin, Germany | 19.1 | 17.3 | 15.6 | 13.2 | 13.0 | 12.8 | 12.8 | 12.9 | 15.0 | 17.5 | 19.9 | 19.8 | 12.8 (Jul) | 19.9 (Nov) | 7.1 |
| Munich, Germany | 17.9 | 16.4 | 14.6 | 13.2 | 13.6 | 13.6 | 13.4 | 13.7 | 15.8 | 17.4 | 19.0 | 18.7 | 13.2 (Apr) | 19.0 (Nov) | 5.8 |
| Zurich, Switzerland | 17.5 | 15.8 | 14.3 | 13.3 | 13.8 | 13.6 | 13.5 | 14.2 | 15.8 | 17.6 | 18.5 | 18.4 | 13.3 (Apr) | 18.5 (Nov) | 5.2 |
| Vienna, Austria | 17.4 | 15.4 | 14.0 | 12.7 | 13.0 | 13.0 | 12.4 | 12.7 | 14.5 | 16.5 | 18.1 | 18.2 | 12.4 (Jul) | 18.2 (Dec) | 5.8 |
| Prague, Czechia | 17.6 | 16.0 | 14.6 | 12.9 | 13.1 | 13.1 | 12.5 | 12.5 | 14.5 | 16.6 | 18.5 | 18.2 | 12.5 (Aug) | 18.5 (Nov) | 6.0 |
| Warsaw, Poland | 18.9 | 17.6 | 15.2 | 13.0 | 13.0 | 13.2 | 13.5 | 13.7 | 15.8 | 17.6 | 19.8 | 19.8 | 13.0 (Apr) | 19.8 (Dec) | 6.8 |
| Copenhagen, Denmark | 20.0 | 19.0 | 17.0 | 14.7 | 14.1 | 14.4 | 14.6 | 15.3 | 16.8 | 18.4 | 20.0 | 20.7 | 14.1 (May) | 20.7 (Dec) | 6.6 |
| Stockholm, Sweden | 18.9 | 18.1 | 15.8 | 14.1 | 13.5 | 14.0 | 14.5 | 15.6 | 16.8 | 18.3 | 20.2 | 20.0 | 13.5 (May) | 20.2 (Nov) | 6.7 |
| Oslo, Norway | 19.4 | 18.1 | 15.4 | 13.8 | 12.8 | 12.9 | 13.8 | 15.2 | 16.1 | 18.2 | 20.2 | 20.2 | 12.8 (May) | 20.2 (Nov) | 7.4 |
| Helsinki, Finland | 20.6 | 19.8 | 17.3 | 14.5 | 12.9 | 13.5 | 14.1 | 15.7 | 17.7 | 19.3 | 21.0 | 21.0 | 12.9 (May) | 21.0 (Nov) | 8.1 |
| Rome, Italy | 15.7 | 14.7 | 14.3 | 14.3 | 13.6 | 12.2 | 11.3 | 11.6 | 13.4 | 15.2 | 16.2 | 16.0 | 11.3 (Jul) | 16.2 (Nov) | 4.9 |
| Milan, Italy | 16.2 | 14.4 | 12.6 | 12.3 | 12.1 | 11.6 | 11.0 | 11.6 | 13.3 | 15.7 | 16.8 | 16.8 | 11.0 (Jul) | 16.8 (Dec) | 5.8 |
| Athens, Greece | 15.0 | 14.2 | 13.0 | 11.6 | 10.4 | 9.1 | 8.6 | 8.9 | 10.5 | 12.5 | 14.5 | 15.2 | 8.6 (Jul) | 15.2 (Dec) | 6.6 |
| Sofia, Bulgaria | 17.1 | 15.4 | 13.6 | 13.0 | 13.7 | 13.4 | 12.7 | 12.3 | 13.2 | 15.0 | 16.5 | 17.4 | 12.3 (Aug) | 17.4 (Dec) | 5.1 |
| Bucharest, Romania | 19.5 | 16.9 | 14.1 | 13.0 | 12.9 | 13.0 | 12.2 | 11.7 | 12.9 | 15.7 | 18.4 | 19.8 | 11.7 (Aug) | 19.8 (Dec) | 8.1 |
| Budapest, Hungary | 18.3 | 16.2 | 13.5 | 12.0 | 12.5 | 12.6 | 12.0 | 12.2 | 13.7 | 15.9 | 18.1 | 19.3 | 12.0 (Jul) | 19.3 (Dec) | 7.3 |
| Zagreb, Croatia | 17.9 | 15.4 | 13.4 | 12.9 | 13.1 | 12.9 | 12.1 | 12.5 | 14.6 | 16.6 | 18.3 | 19.2 | 12.1 (Jul) | 19.2 (Dec) | 7.1 |
Method and scope#
We obtained daily mean air temperature and relative humidity at 2 m from the Open-Meteo Historical Weather API, with models=era5, temperature_2m_mean and relative_humidity_2m_mean. The period is 1 January 1991 to 31 December 2020. We made one request per city at its city-centre coordinates, covering 10,958 days per city.
Each monthly climate value is the mean of all daily values for that calendar month over the 30 years. Open-Meteo returns the nearest ERA5 grid cell on a 0.25 degree grid, roughly 25 to 30 km across. A grid cell describes the area around the city, rather than a single weather station, and a coastal cell can include sea.
We apply the Wood Handbook's Equation (4-5) to each month's mean temperature and mean relative humidity. This follows the monthly climate-input approach of W. T. Simpson's 1998 research note, Equilibrium moisture content of wood in outdoor locations in the United States and worldwide. Our European values are new calculations using Open-Meteo climate inputs.
The table represents conditions towards which wood kept outdoors under cover, such as in a shed or unheated store, moves. It is not an indoor moisture table. Direct rain, sunlight and heating change the exposure, while monthly climate means describe the seasonal background rather than a particular day.
Weather data by Open-Meteo.com, under CC BY 4.0. ERA5 data: Copernicus Climate Change Service, ECMWF. We aggregated the climate inputs and calculated wood EMC, transforming the original weather data. The city table is available as a CSV file.
Source: Open-Meteo, Historical Weather API documentation and Licence; Copernicus, ERA5 overview and dataset; Simpson, FPL-RN-0268.
Why heated winter rooms can dry slabs#
Our heating scenario takes each city's January outdoor air and warms it to 21 °C without adding moisture. Our calculation gives Lisbon an EMC of 8.4 percent, compared with 3.8 percent for Helsinki and 4.1 percent for Oslo. Berlin's estimate is 5.0 percent, while Sofia's is 4.6 percent.
| City | January outdoors: mean temperature | January outdoors: mean relative humidity | Outdoor EMC in January | Same air heated to 21 °C: relative humidity | Same air heated to 21 °C: EMC |
|---|---|---|---|---|---|
| Lisbon | 11.8 °C | 80% | 16.4% | 45% | 8.4% |
| Madrid | 5.5 °C | 77% | 15.5% | 28% | 5.9% |
| Barcelona | 9.5 °C | 78% | 15.8% | 37% | 7.3% |
| Paris | 4.7 °C | 87% | 19.6% | 30% | 6.2% |
| London | 5.3 °C | 86% | 19.1% | 31% | 6.3% |
| Dublin | 6.3 °C | 86% | 19.0% | 33% | 6.7% |
| Brussels | 3.9 °C | 87% | 19.2% | 28% | 5.9% |
| Amsterdam | 3.6 °C | 87% | 19.6% | 28% | 5.8% |
| Berlin | 0.9 °C | 86% | 19.1% | 23% | 5.0% |
| Munich | 0.4 °C | 84% | 17.9% | 21% | 4.7% |
| Zurich | 2.0 °C | 83% | 17.5% | 24% | 5.1% |
| Vienna | 0.6 °C | 82% | 17.4% | 21% | 4.7% |
| Prague | 0.4 °C | 83% | 17.6% | 21% | 4.7% |
| Warsaw | -1.5 °C | 86% | 18.9% | 19% | 4.3% |
| Copenhagen | 1.1 °C | 88% | 20.0% | 24% | 5.1% |
| Stockholm | -1.4 °C | 86% | 18.9% | 19% | 4.3% |
| Oslo | -2.5 °C | 87% | 19.4% | 18% | 4.1% |
| Helsinki | -3.9 °C | 89% | 20.6% | 16% | 3.8% |
| Rome | 7.7 °C | 78% | 15.7% | 33% | 6.6% |
| Milan | 3.5 °C | 79% | 16.2% | 25% | 5.4% |
| Athens | 9.3 °C | 76% | 15.0% | 36% | 7.0% |
| Sofia | 0.3 °C | 82% | 17.1% | 21% | 4.6% |
| Bucharest | -1.0 °C | 87% | 19.5% | 20% | 4.5% |
| Budapest | 0.1 °C | 85% | 18.3% | 21% | 4.7% |
| Zagreb | 1.4 °C | 84% | 17.9% | 23% | 5.0% |
We calculate heated-air relative humidity as outdoor relative humidity × es(outdoor temperature) ÷ es(21 °C), using the Magnus formula es(T) = 6.112 × exp(17.62 × T ÷ (243.12 + T)), where es is saturation vapour pressure in hPa and T is temperature in °C. We then use the Wood Handbook equation to calculate EMC from the heated air's temperature and relative humidity.
This is a lower-bound scenario for air heated without added moisture. It is not a measured indoor value or a guaranteed minimum for every room. People, cooking and humidifiers add moisture, so real occupied rooms are usually less dry than this scenario.
The USDA Forest Products Laboratory explains that indoor humidity also depends on moisture sources, ventilation and humidity control. Our table shows why slabs shrink during the heating season, especially in cold continental cities.
Source: Our calculations using Open-Meteo ERA5 climate inputs, the Magnus formula above and the Wood Handbook EMC equation; physical context from the USDA Forest Products Laboratory, drying and moisture control.
What to do with the numbers#
Let the slab reach the room's moisture conditions before final flattening. The USDA Forest Products Laboratory recommends matching wood moisture content to service conditions. Final flattening after acclimatisation applies that principle to slab work.
Fix tops so that they can move. Use slotted holes, table-top fasteners or C-channels with slots that allow movement across the grain. Do not glue or screw a solid top rigidly across the grain. Breadboard ends need a sliding joint.
A slab containing the pith tends to cup and split, so allow for that risk when selecting and preparing it. Finish all faces, including the underside and edges. The Wood Handbook explains that coatings slow moisture exchange but do not prevent it.
Source: USDA Forest Products Laboratory, moisture control and service conditions and the effect of coatings on moisture exchange.
Frequently asked questions#
How much does oak move with humidity?#
Using LWF oak coefficients, our calculation gives 13.0 mm of movement across a 900 mm flat-sawn top for a moisture change of 4 percentage points. The quarter-sawn estimate is 5.8 mm. Air humidity must first be translated into wood moisture content.
What is equilibrium moisture content?#
The USDA Forest Products Laboratory defines equilibrium moisture content as the moisture content at which wood is neither gaining nor losing moisture. It depends on the surrounding air's relative humidity and temperature.
How much will a 1 metre wide table top move?#
For European oak and a 4-point moisture change, our calculation is 1,000 × 0.36 ÷ 100 × 4 = 14.4 mm flat-sawn and 1,000 × 0.16 ÷ 100 × 4 = 6.4 mm quarter-sawn. Other species and moisture changes scale by the same formula.
Does quarter sawn wood move less?#
Usually, across its width. The USDA Forest Products Laboratory uses radial shrinkage for quarter-sawn material and tangential shrinkage for flat-sawn material. Quarter-sawn wood still needs joints and fixings that allow movement.
What moisture content should wood be outdoors in Europe?#
Our outdoor table for 1991 to 2020 ranges from 7.0 percent in Madrid in July to 21.0 percent in Helsinki in November and December. These estimates apply to wood under cover. The appropriate moisture content depends on location, season and exposure.
Source: Our calculations; LWF Wissen 75; USDA Forest Products Laboratory, Wood Handbook.
For related context, see moisture changes during transport and our European oak species page.
How to cite this page#
KORENA Journal, “Wood movement in numbers”, korena.eu/journal/wood-movement-shrinkage-table, figures checked 20 November 2026.
For the city table, add: “climate data: Open-Meteo (ERA5), 1991 to 2020”. Identify the table used and retain its distinction between outdoor equilibrium conditions and the winter heating scenario.
Last updated: 20 November 2026.
Sources#
- USDA Forest Products Laboratory. Wood handbook: wood as an engineering material. FPL-GTR-282, 2021, chapters on moisture relations and drying. Publication record, moisture relations chapter, drying chapter. Accessed 20 November 2026.
- Bavarian State Institute of Forestry, Gabriele Ehmcke and Dietger Grosser. Das Holz der Eiche: Eigenschaften und Verwendung. LWF Wissen 75, Tabelle 3. Document. Accessed 20 November 2026.
- CIRAD. CHÊNE. Tropix 7 species sheet, physical properties. Document. Accessed 20 November 2026.
- CIRAD. HÊTRE. Tropix 7 species sheet, physical properties. Document. Accessed 20 November 2026.
- CIRAD. FRÊNE. Tropix 7 species sheet, physical properties. Document. Accessed 20 November 2026.
- CIRAD. NOYER. Tropix 7 species sheet, physical properties. Document. Accessed 20 November 2026.
- GD Holz. Nussbaum (europäisch). Holzarten-ABC, technical properties. Reference. Accessed 20 November 2026.
- GD Holz. Nussbaum (amerikanisch). Holzarten-ABC, technical properties. Reference. Accessed 20 November 2026.
- CIRAD. ERABLE SYCOMORE. Tropix 7 species sheet, physical properties. Document. Accessed 20 November 2026.
- GD Holz. Ahorn. Holzarten-ABC. Reference. Accessed 20 November 2026.
- CIRAD. CHÂTAIGNIER. Tropix 7 species sheet, physical properties. Document. Accessed 20 November 2026.
- University of Sopron, Fanni Pozsgayné Fodor. Acetylation of European Hornbeam (Carpinus betulus L.) Wood for Outdoor Applications. Dissertation, 2023, reproducing Molnár and Bariska (2002). Document. Access attempted 20 November 2026; retrieval unsuccessful.
- GD Holz. Hainbuche. Holzarten-ABC, technical properties. Reference. Accessed 20 November 2026.
- CIRAD. ROBINIER. Tropix 7 species sheet, physical properties. Document. Accessed 20 November 2026.
- Verlag Handwerk und Technik. Arbeitsheft Grundkenntnisse Holztechnik, Lernfelder 1 bis 4, section 4.5 Holzfeuchte. Workbook extract. Access attempted 20 November 2026; retrieval unsuccessful.
- CIRAD. MERISIER. Tropix 7 species sheet, physical properties. Document. Accessed 20 November 2026.
- GD Holz. Kirschbaum (europäisch). Holzarten-ABC, technical properties. Reference. Accessed 20 November 2026.
- Holzhandel Marianne Frey-Amon. Ulme, Ruste, Ulmus sp. Timber reference, shrinkage and swelling fields. Reference. Accessed 20 November 2026.
- W.A.V.E. Catalogue des essences du projet W.A.V.E., TILLEUL entry. Species catalogue, 2025. Document. Access attempted 20 November 2026; retrieval exceeded the tool's document-size limit.
- GD Holz. Linde. Holzarten-ABC, technical properties. Reference. Accessed 20 November 2026.
- Finnish Society of Forest Science, Katri Luostarinen and Erkki Verkasalo. Birch As Sawn Timber and in Mechanical Further Processing in Finland: A Literature Study. Silva Fennica Monographs 1, 2000. Document. Accessed 20 November 2026.
- GD Holz. Birke. Holzarten-ABC, technical properties. Reference. Accessed 20 November 2026.
- CIRAD. MELEZE. Tropix 6 species sheet embedded in the timber document. Document. Access attempted 20 November 2026; retrieval unsuccessful.
- CIRAD. EPICEA. Tropix 7 species sheet, physical properties. Document. Accessed 20 November 2026.
- CIRAD. PIN SYLVESTRE. Tropix 7 species sheet, physical properties. Document. Accessed 20 November 2026.
- Open-Meteo. Historical Weather API documentation, including Citation & Acknowledgement. Software citation: P. Zippenfenig, Open-Meteo.com Weather API, 2023. Documentation. Accessed 20 November 2026.
- Open-Meteo. Licence, API data attribution requirements. Licence page. Accessed 20 November 2026.
- Creative Commons. Attribution 4.0 International, CC BY 4.0. Licence. Accessed 20 November 2026.
- Copernicus Climate Change Service, ECMWF. Climate reanalysis, ERA5 overview. Reference. Accessed 20 November 2026.
- Copernicus Climate Change Service, ECMWF, Hersbach and colleagues. ERA5 hourly data on single levels from 1940 to present. DOI: 10.24381/cds.adbb2d47. Dataset. Accessed 20 November 2026.
- USDA Forest Products Laboratory, W. T. Simpson. Equilibrium moisture content of wood in outdoor locations in the United States and worldwide. Research Note FPL-RN-0268, 1998. Document. Accessed 20 November 2026.
The following references accompanied our species dataset. They concern density, which is not used in this article's movement calculations.
- USDA Forest Products Laboratory, Harry A. Alden. Hardwoods of North America. FPL-GTR-83, 1995. Document. Accessed 20 November 2026.
- Warsaw University of Life Sciences, Ewa Dobrowolska, Paulina Wroniszewska and Agnieszka Jankowska. Density Distribution in Wood of European Birch (Betula pendula Roth.). Forests, 2020, 11, 445. Article. Accessed 20 November 2026.
- PEFC. Reference Density Values of Wood Species and Wood-Based Panels. Furniture calculator reference. Document. Accessed 20 November 2026.